
Azure Monitor maximizes the availability and performance of applications by delivering a comprehensive solution for collecting, analyzing, and acting on telemetry from cloud and on-premises environments. It helps understanding how applications are performing and proactively identifies issues affecting them and the resources they depend on.
Get the granular, real-time monitoring data you need—all in one place!
- No upfront cost
- No termination fees
- Pay only for what you need
Azure Monitoring Pricing:
Log Analytics
Log Analytics is billed per gigabyte (GB) of data ingested into the service.
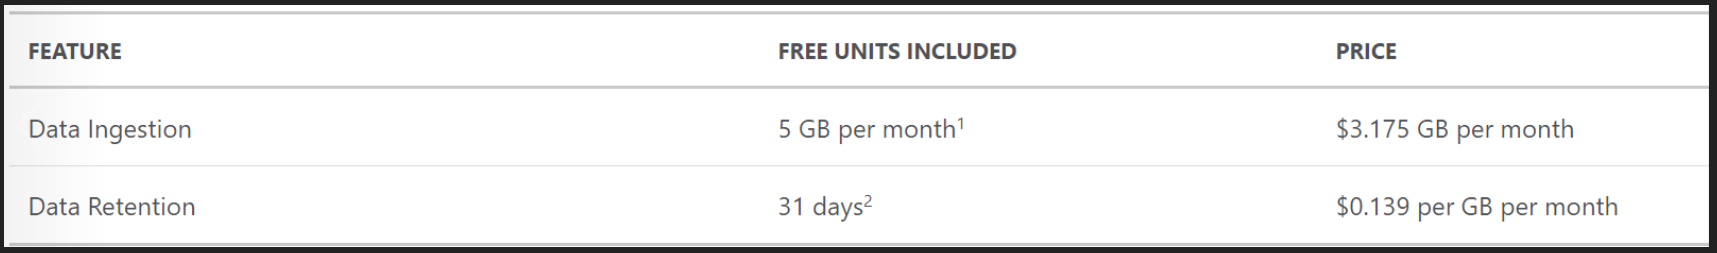
- 1. The first 5 GB of data ingested to the Azure Log Analytics service every month is offered free.
- 2. Every GB of data ingested into your Azure Log Analytics workspace is retained at no charge for the first 31 days.
Metrics
A metric represents a set of time-series. You are billed based on the number of time-series monitored and API calls made.
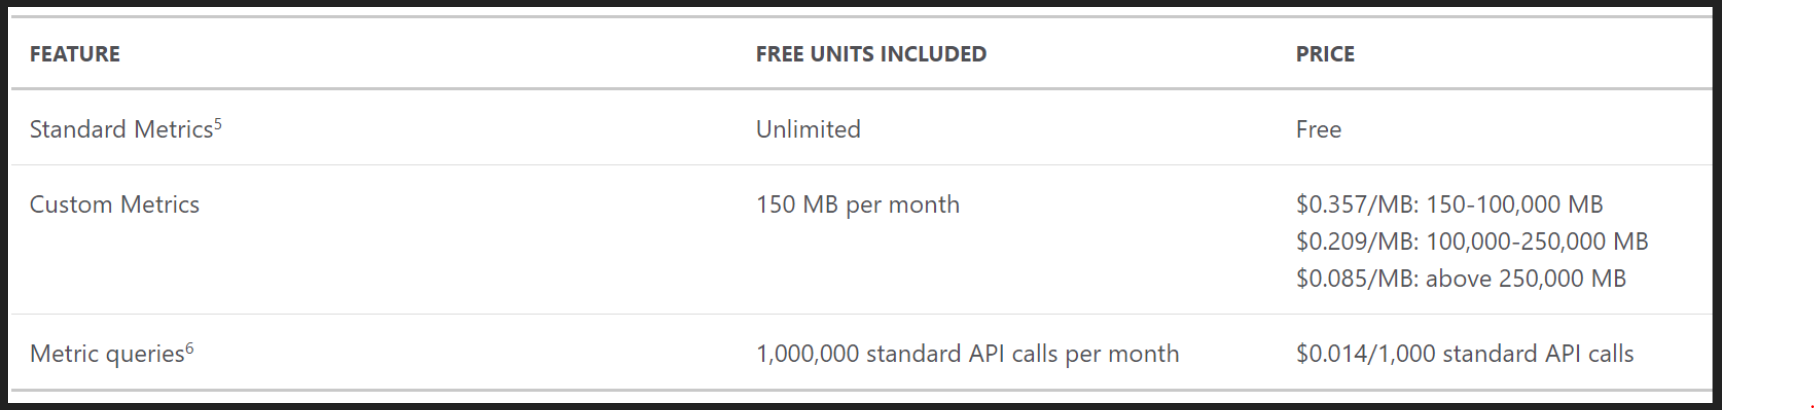
Standard metrics are available for free and include select metrics originating from Azure resources, services and first party solutions.
Unified Monitoring:
A common platform for all metrics, logs and other monitoring telemetry
High-level view of Azure Monitor:

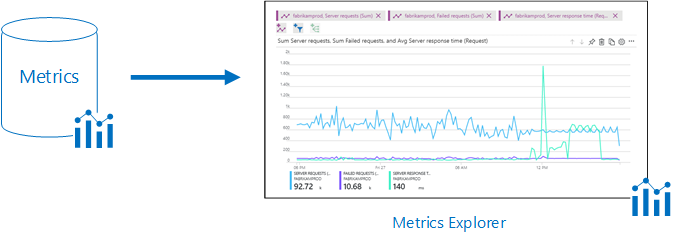
All data collected by Azure Monitor fits into one of two fundamental types Metricsand Logs.
Metrics: Numerical values that describe some aspect of a system at a particular point in time. They are lightweight and capable of supporting near real-time scenarios.
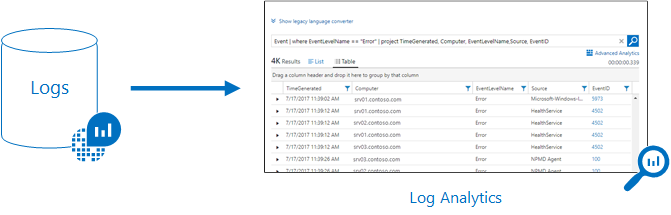
Logs: Telemetry such as events and traces are stored as logs in addition to performance data so that it can all be combined for analysis.
Data Driven Insights
Advanced diagnostics and analytics powered by machine learning capabilities.
Azure Monitor for VMs:
Azure Monitor VM insights monitors your Azure virtual machines (VM) at scale by analysing the performance and health of your Windows and Linux VMs, including their different processes and interconnected dependencies on other resources and external processes. The solution includes support for monitoring performance and application dependencies for VMs hosted on-premises or another cloud provider.
Challenges in VM Monitoring
- 1. Figure out what and how to Monitor
- 2. Disambiguate the issues in the VM, caused due to its usage or Azure itself
- 3. Troubleshoot how guest-level resource constrains impacts workloads/apps
- 4. Identify VM hotspots at scale based on resource utilization
- 5. Determine whether how back-end dependencies are affecting clients
- 6. Determine health and availability of Azure VMs across Resource Groups
Health Diagnostics:
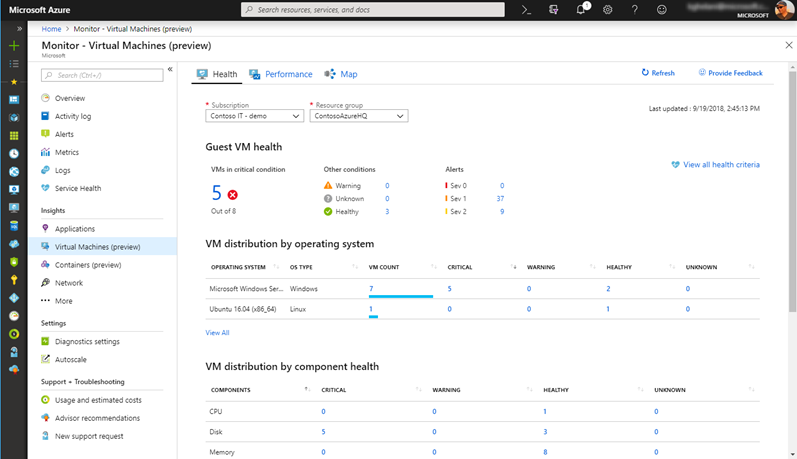
Pre-defined health monitors to jump-start VM monitoring
Near real-time monitoring of core VM components (CPU, Memory,..)
Health diagnostics, that helps to localize the issue fast
KB articles on common causes and resolution
Customizable alerting thresholds on health monitors
Performance:
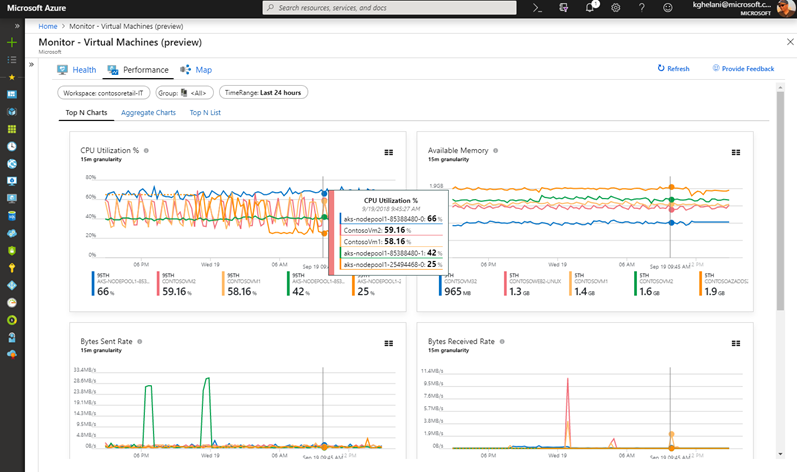
Aggregation of VM metrics across thousands of VMs
Top N performance views identify resource constrained VMs @ scale
Drill through performance diagnostics for root cause analysis
Drill through to advanced analytics on VM logs
Built in views for key performance indicators
Maps:
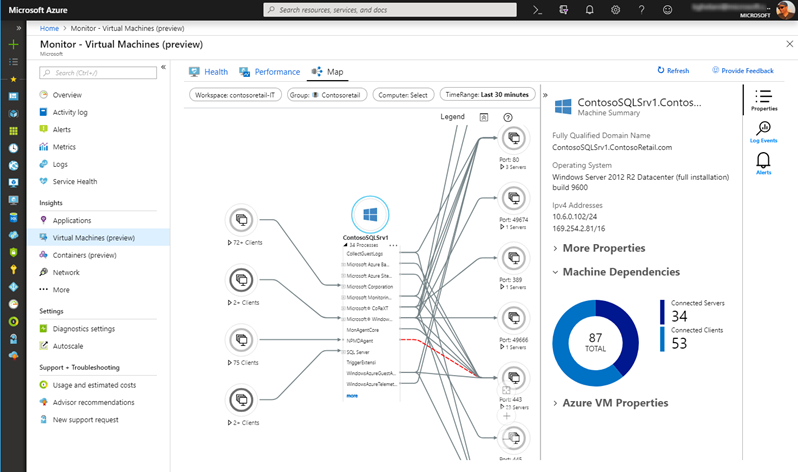
Visualize VMs and process interaction for resource groups, VM scale sets and subscriptions
Identify surprise dependencies and connection failures
Live connection metrics between processes and VMs identifying spikes in network traffic
Drill through dependent VMs to Alerts and Logs
On Boarding:
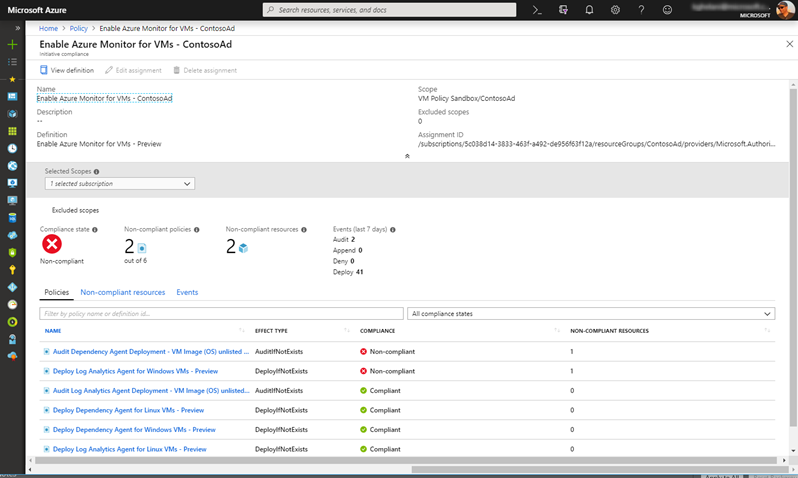
Built-in monitoring policy to on board Azure VMs @ scale
Policy supports existing VMs and new VMs created
Remediation policy to on board VMs falling out of compliance
Alerts:
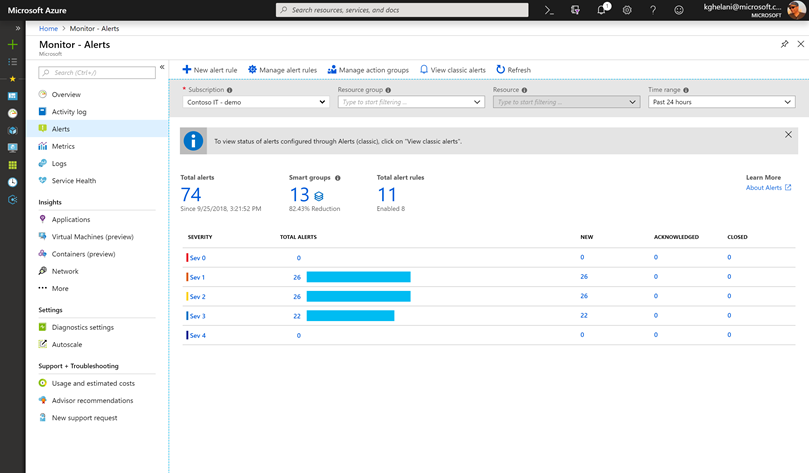
One Alert management experience
Configure Alerts at Scale
Multi-resource alerting
Unified Alert lifecycle Management
Smart grouping to reduce noise
Dynamic threshold base Alerting
Try Azure Subscription for Free.
If this article helped you or if you have further suggestions, please feel free to comment below. 
Recommended Reading:
https://docs.microsoft.com/en-us/azure/azure-monitor/overview